PressureNet was a weather data crowdsourcing app and developer platform. The big idea was if we collected a dense enough web of barometric pressure readings, across a large enough area, we could predict the weather.
My friend Jacob Sheehy and I co-founded Cumulonimbus (named after the very tall, anvil-shaped type of cloud that forms before a storm) to create PressureNet. While my responsibilities included everything from branding, web design for three separate sites, guiding marketing wherever visuals were involved, and learning how to run a business, this case study will focus on the product and design aspect of my work.
The Context
At the very beginning of the project, barometric pressure sensors were only in a few Android devices, running the latest version of the OS software. This gave us a total addressable market of early adopter Android users who happen to be weather nerds.
This was during the early stages of Google trying to bring some sort of consistent app design standards to their ecosystem, even before the Material Design system was created. This was fortunate for me, as it gave some clear guidelines for designing the app and some building blocks to start from. Up to this point I had never worked on a phone app. I'd only recently gotten a "smartphone", for that matter.
The Challenge
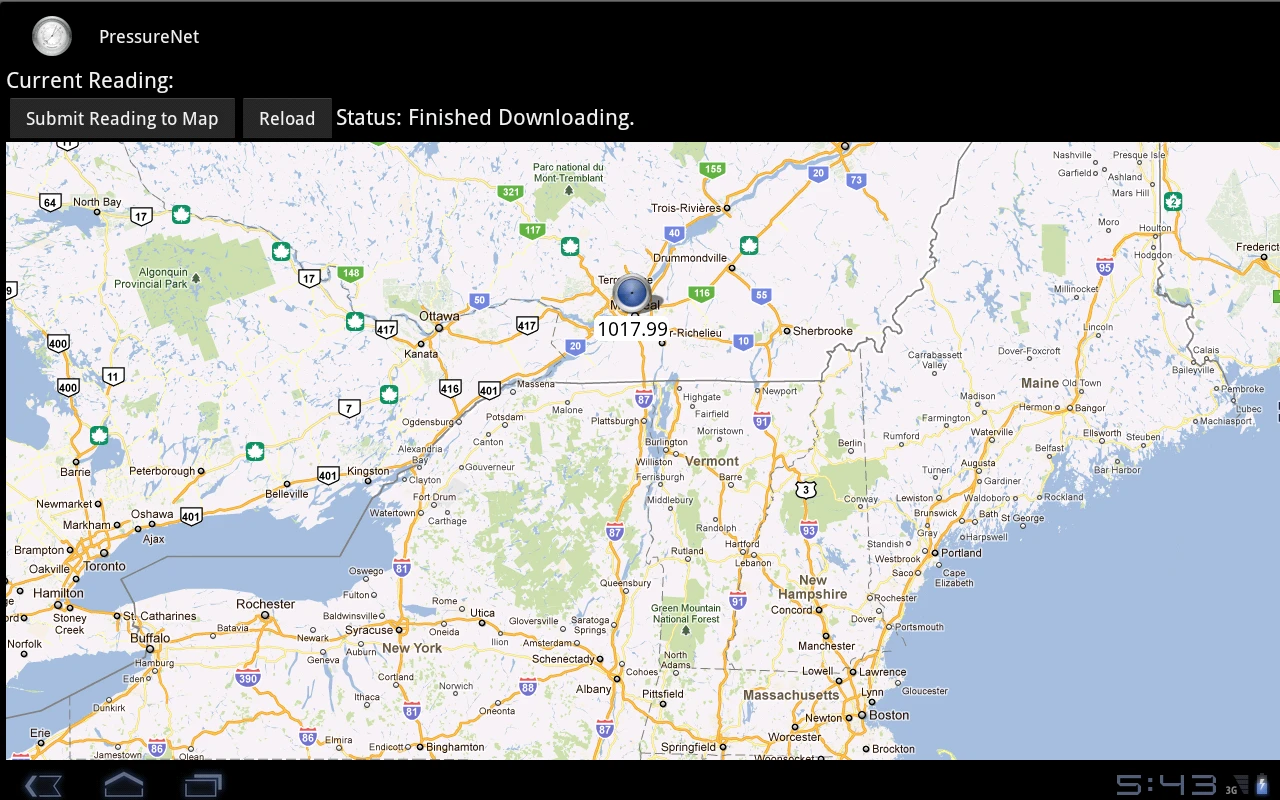
PressureNet V1
The initial version of PressureNet was just a button and pressure readings on a map. All I’d done at this point was make an icon.
Initially, PressureNet would send pressure data from a device whenever the user pressed a button, then displayed it on a map. That's about when Jacob asked me to help out.
We soon added automatic polling, with user defined settings, as well as a home screen widget for the user to see the current pressure, its trend, and a submit button. These changes massively increased the volume of data received from each device, but also automated away any interaction the user needed to have with the app.
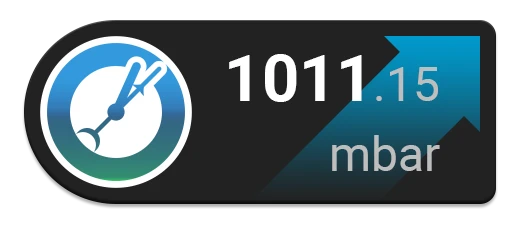
Submit Widget
This button added a tiny activity for users whenever they opened their phone. Pushing the button would both update the current reading and submit it. For a select few this really scratched a citizen-scientist itch to contribute.
Users could view the map and see other people's latest readings, but that wasn't very exciting. We added a readings-over-time graph for all data on the map. This gave a lot more context, but was still very dry. We needed something that would engage our users.
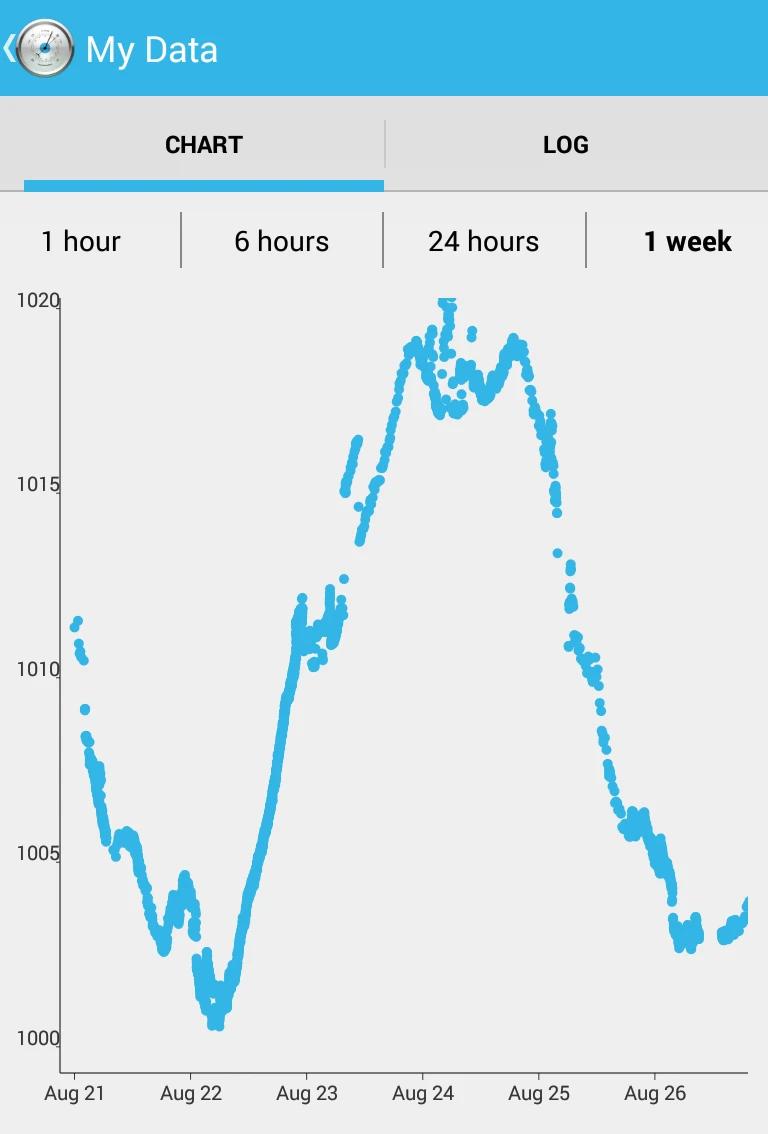
Pressure Chart
Users could track any marker on the map as a series of readings over time. A large drop followed by a rise indicates a storm followed by a clear period.
Despite what felt like a lack of a hook, we were slowly gaining traction through Twitter, Hacker News, traditional media, and university researchers. Tech journalist Nancy Gohring was a regular contact, as well as Cliff Mass, professor of Atmospheric Sciences at U Washington.
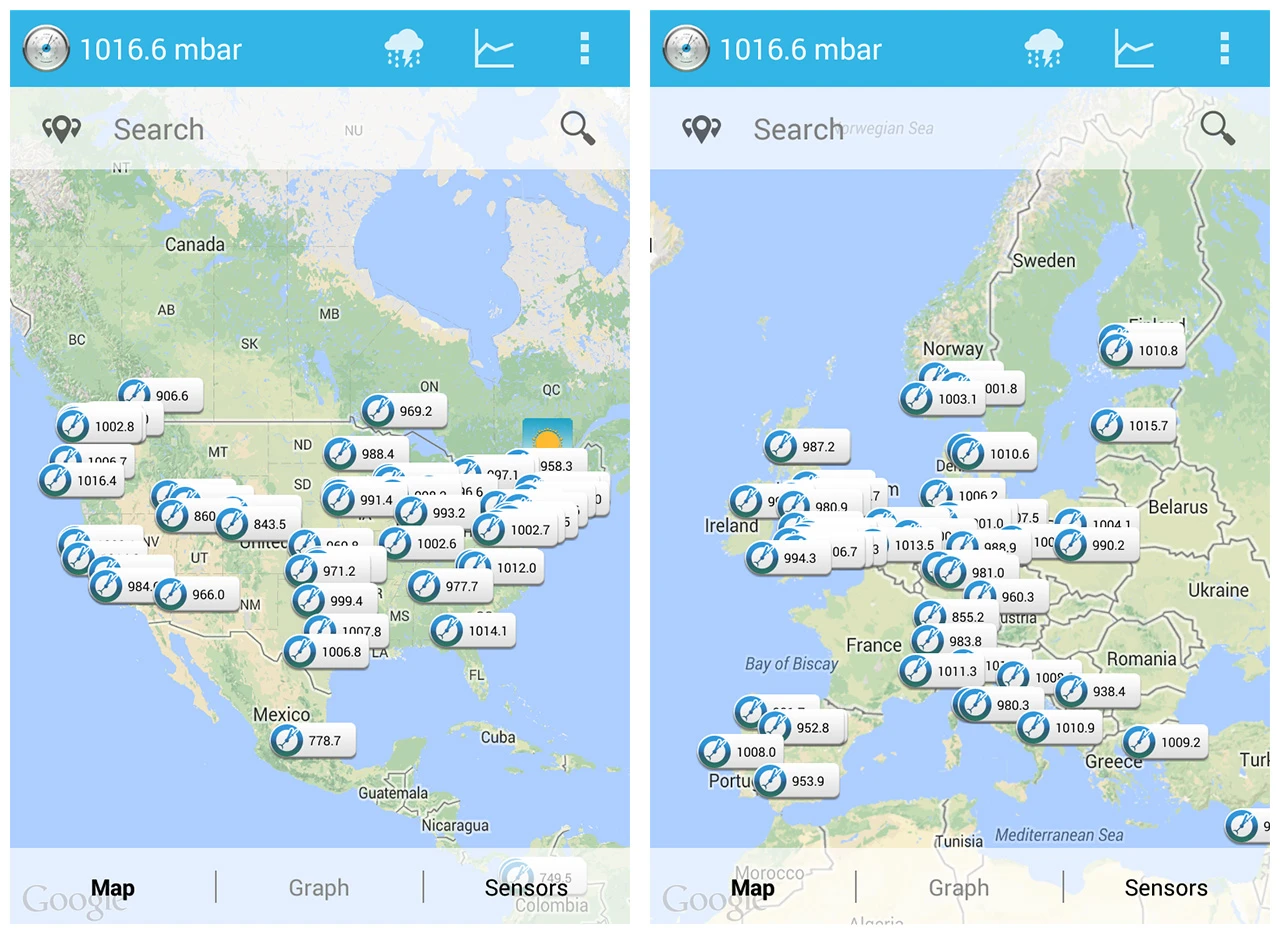
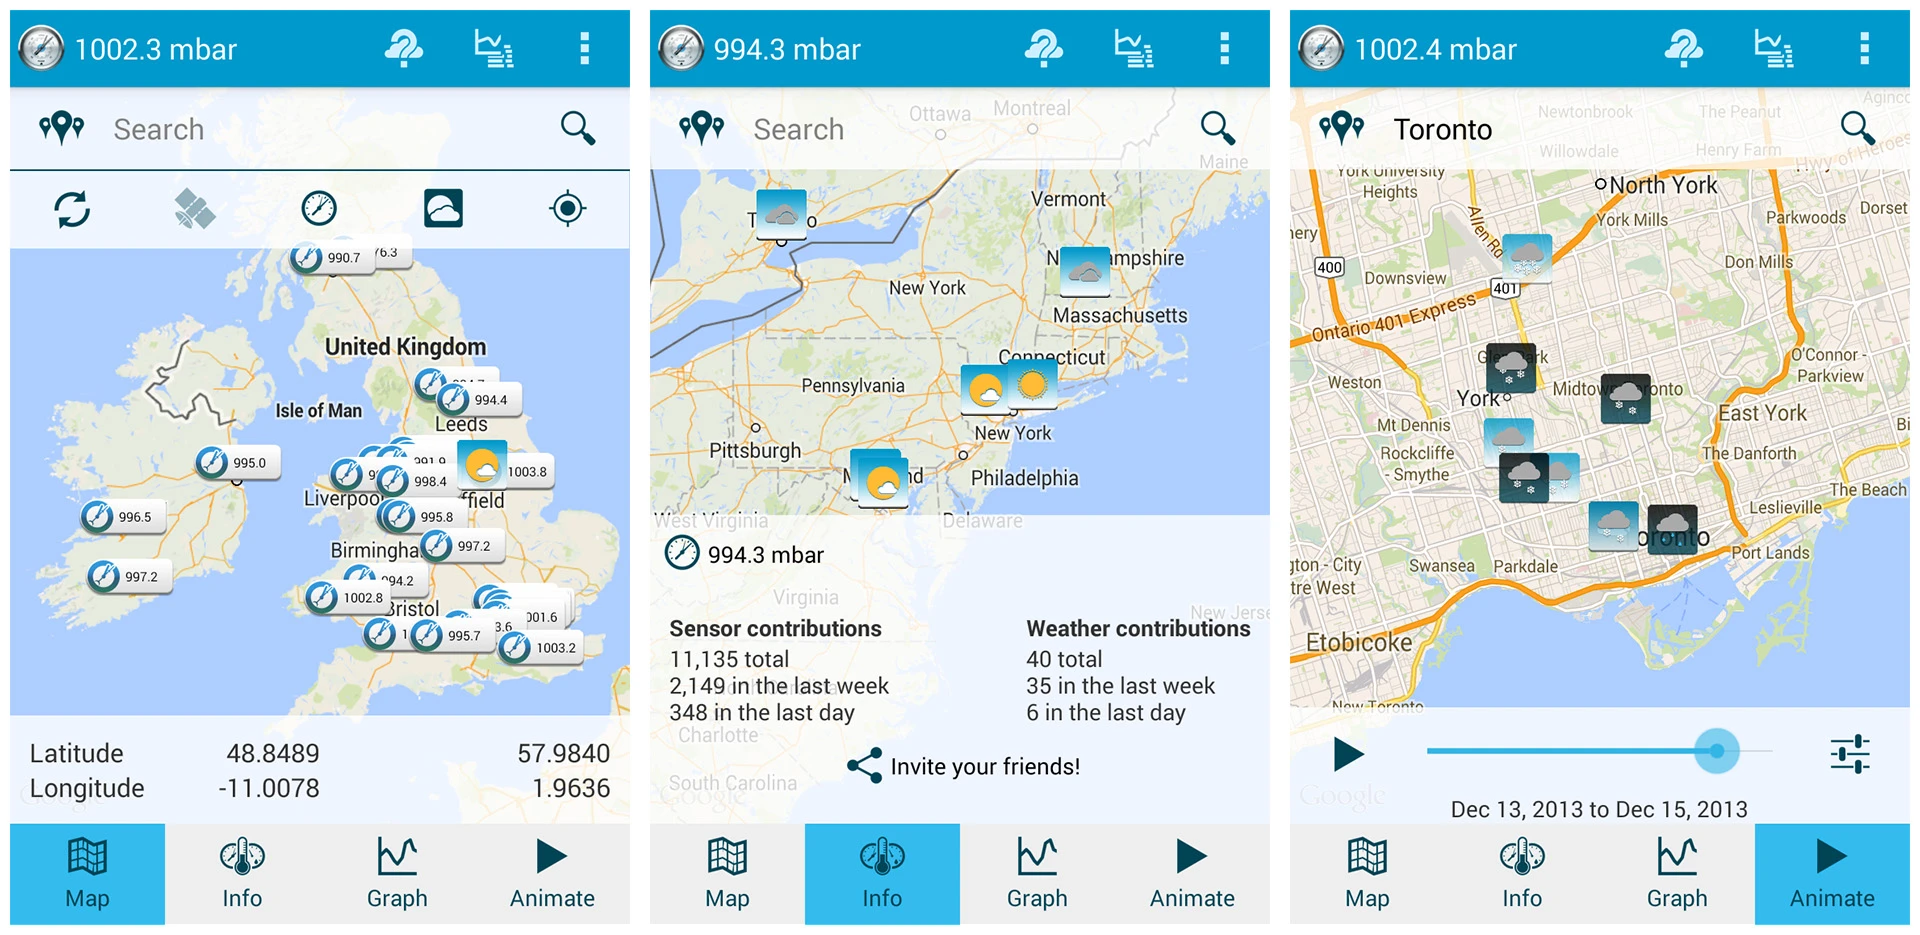
PressureNet in North America and Europe, 2013
Already in 2013 we were seeing a widespread interest in PressureNet across the English speaking world.
Around this time user growth and engagement became our main concern, as we had received funding, working space, and mentorship from the MaRS Jolt Accelerator fund. Through Jolt we were trained on how to actually run a startup, where to focus our efforts, and how to market ourselves. We were also given access to many sources of wisdom in the Toronto tech world, as well as entry, travel, and hotel accommodations for Launch Festival 2014 in San Francisco.
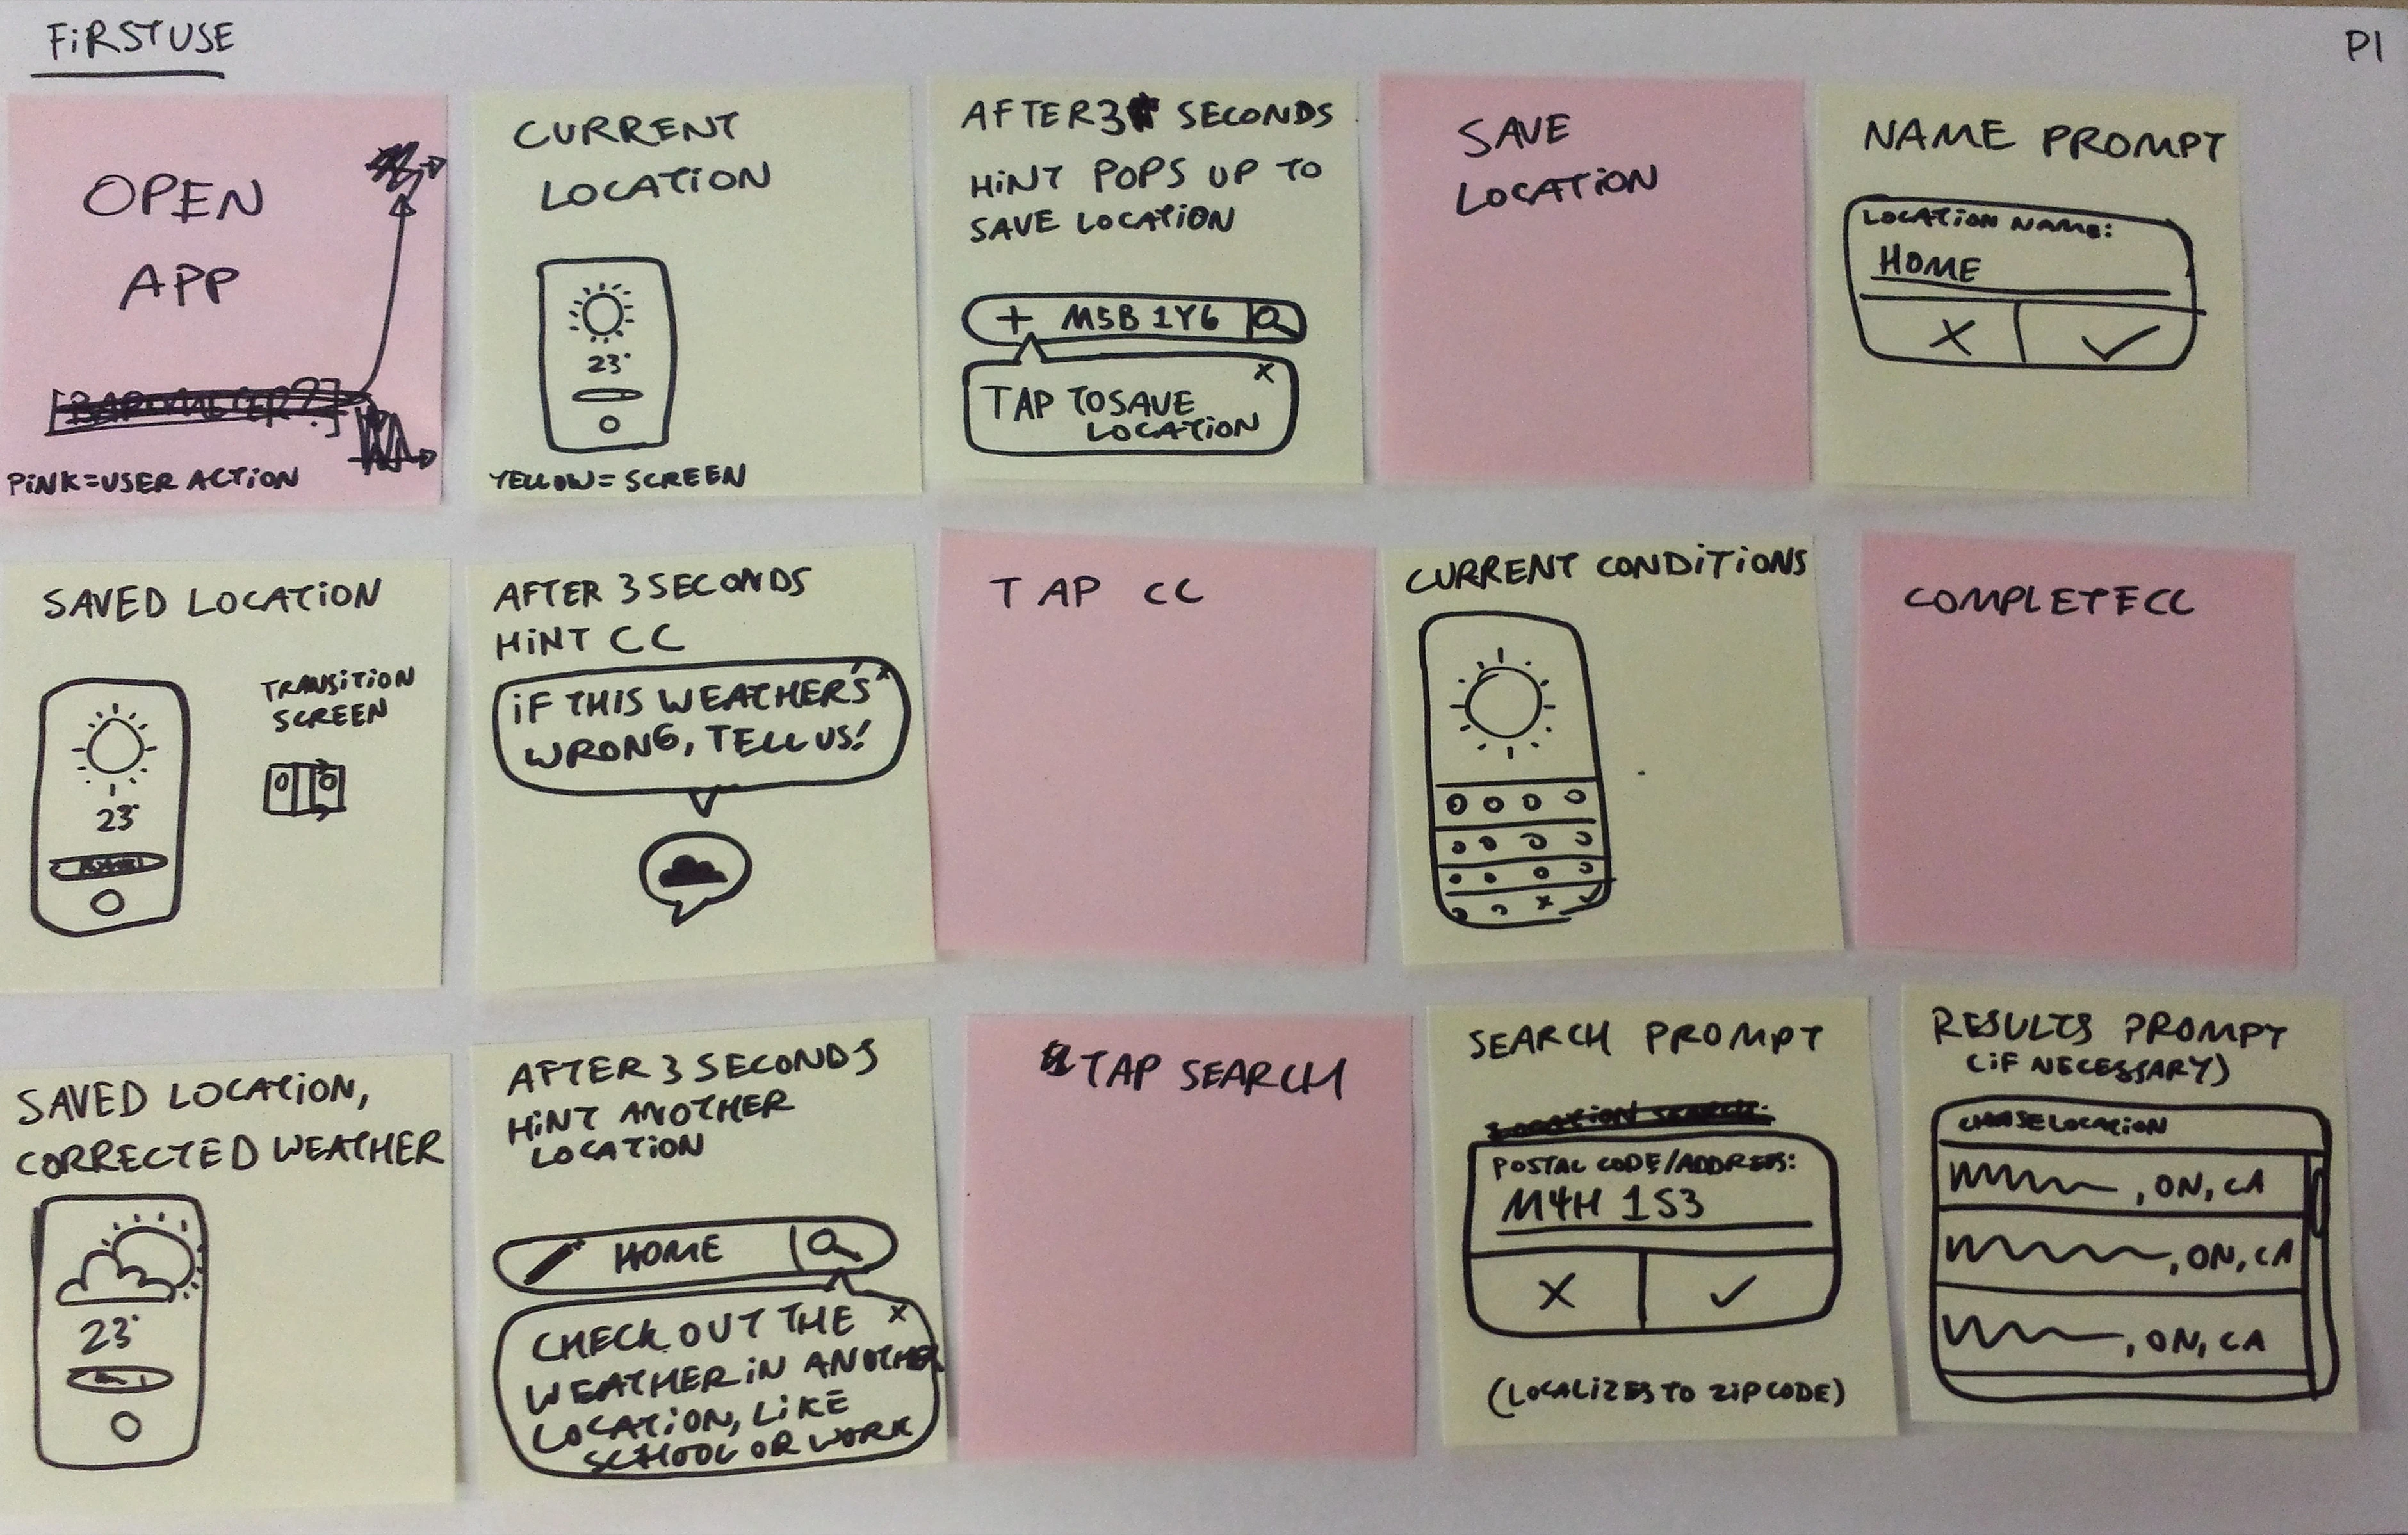
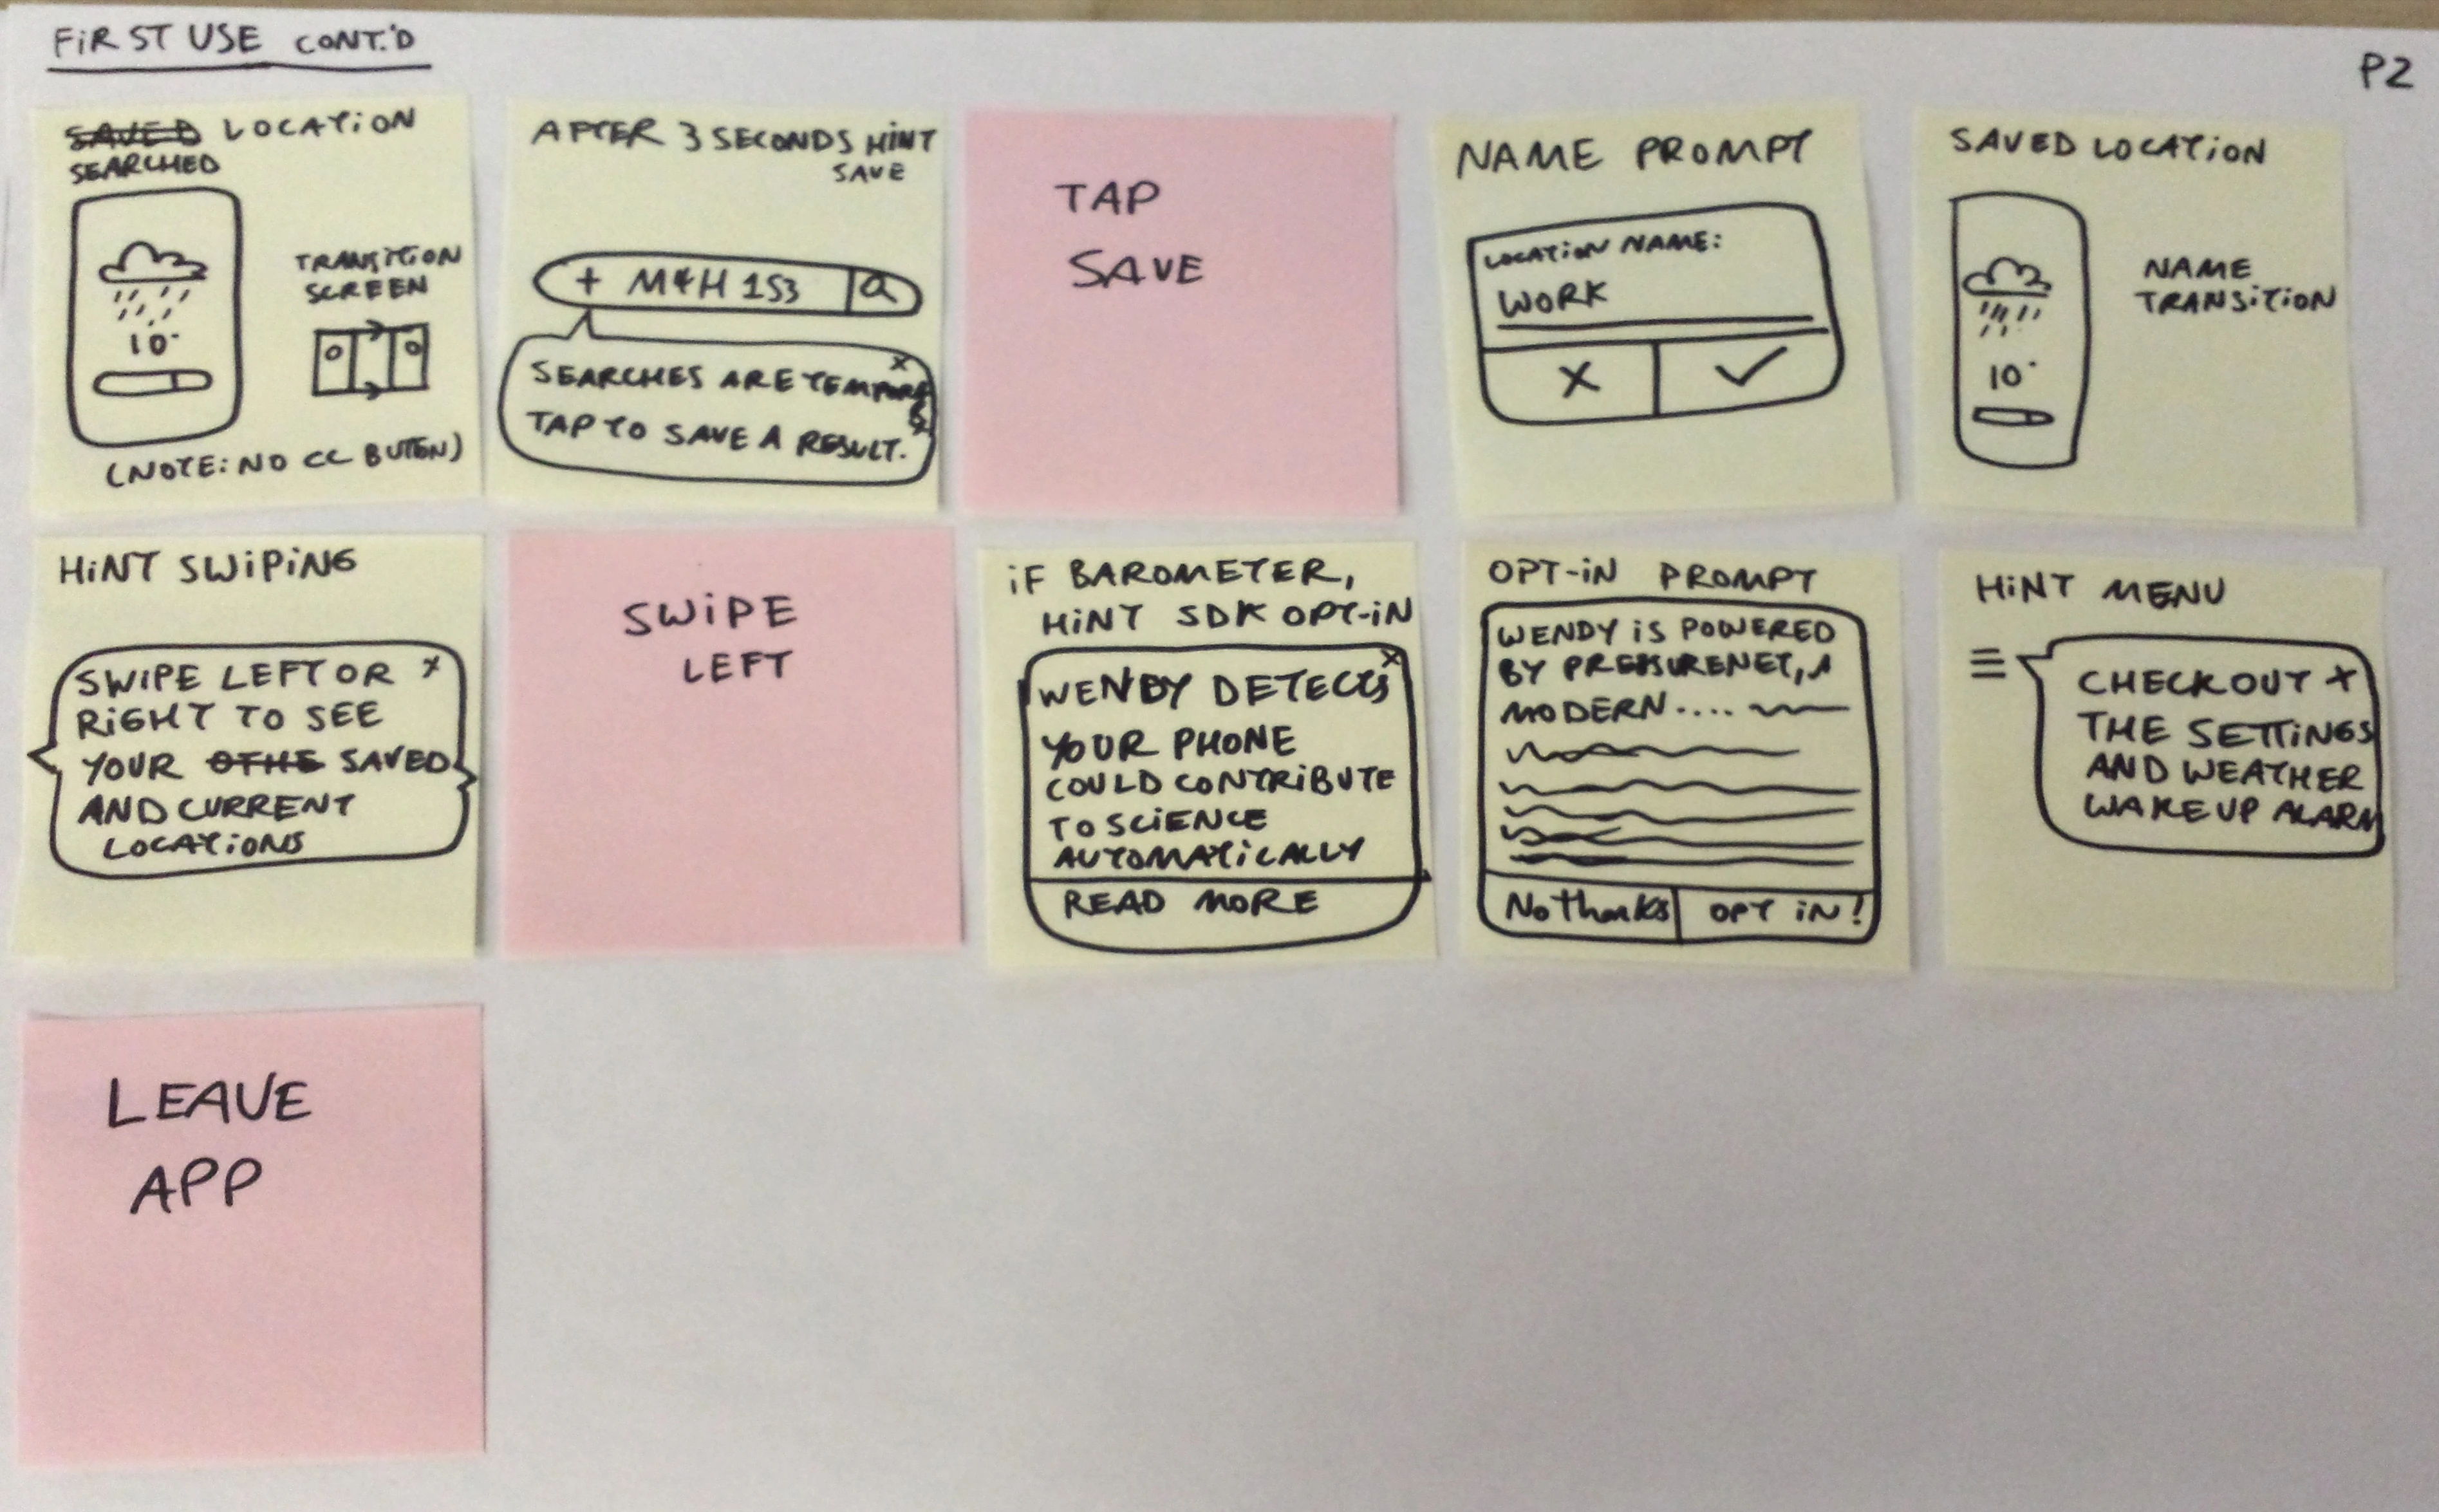
Just Ask
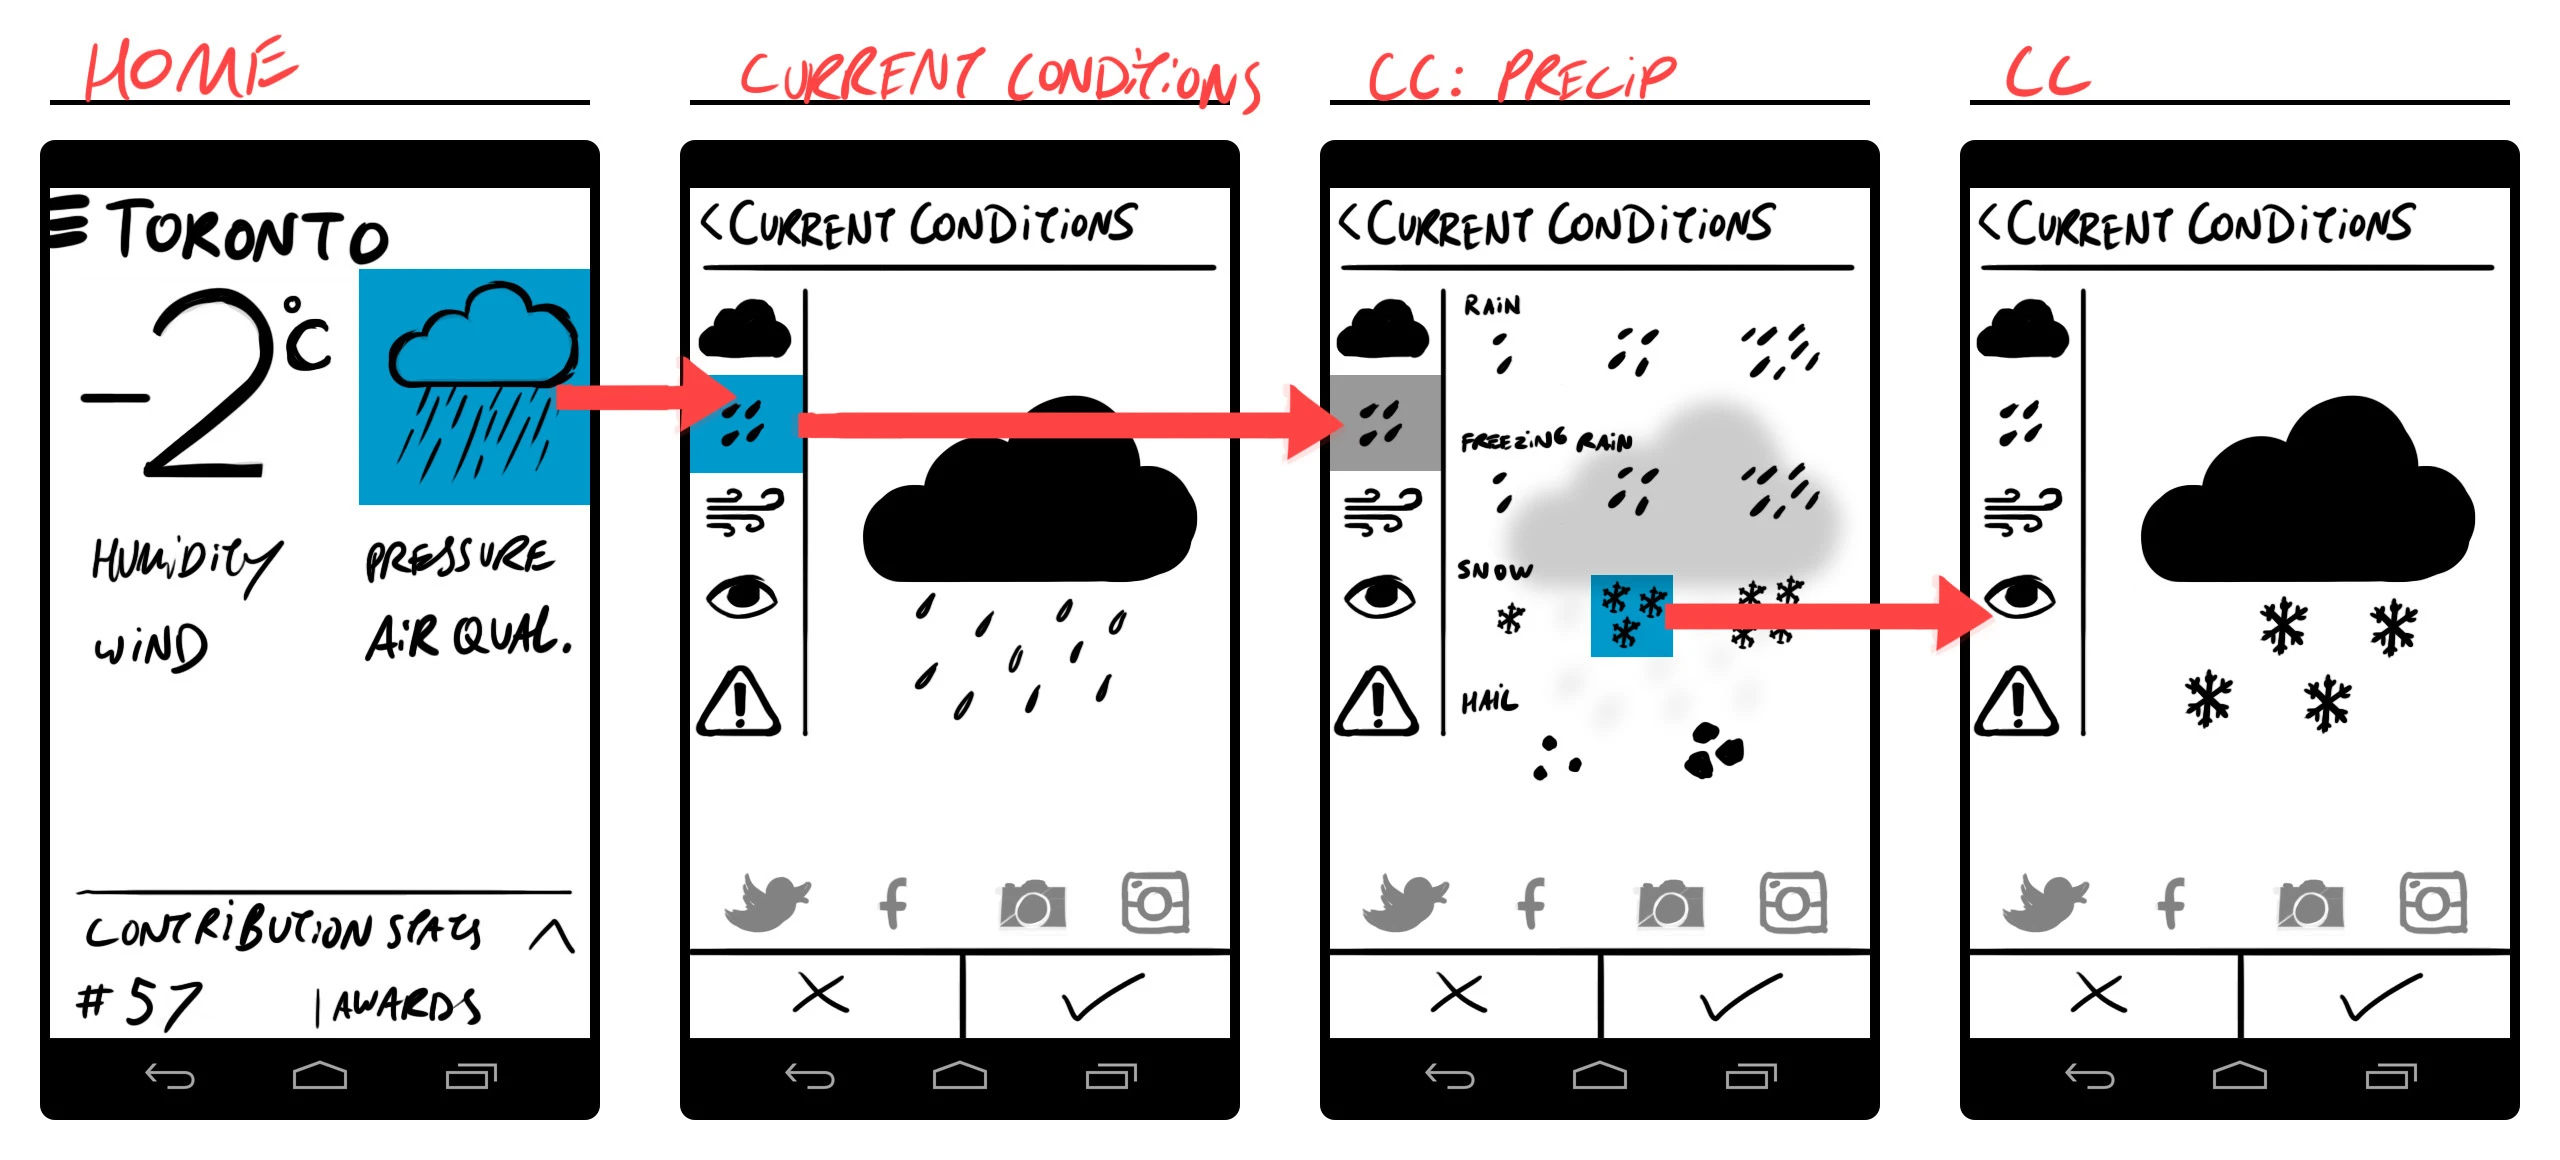
To solve our engagement issue we came up with asking users what the weather was like where they were. This would serve as both extra standalone data, as well as comparative data to test against the measured pressure at the same location. This feature gave agency back to the user along with a sense of active contribution.
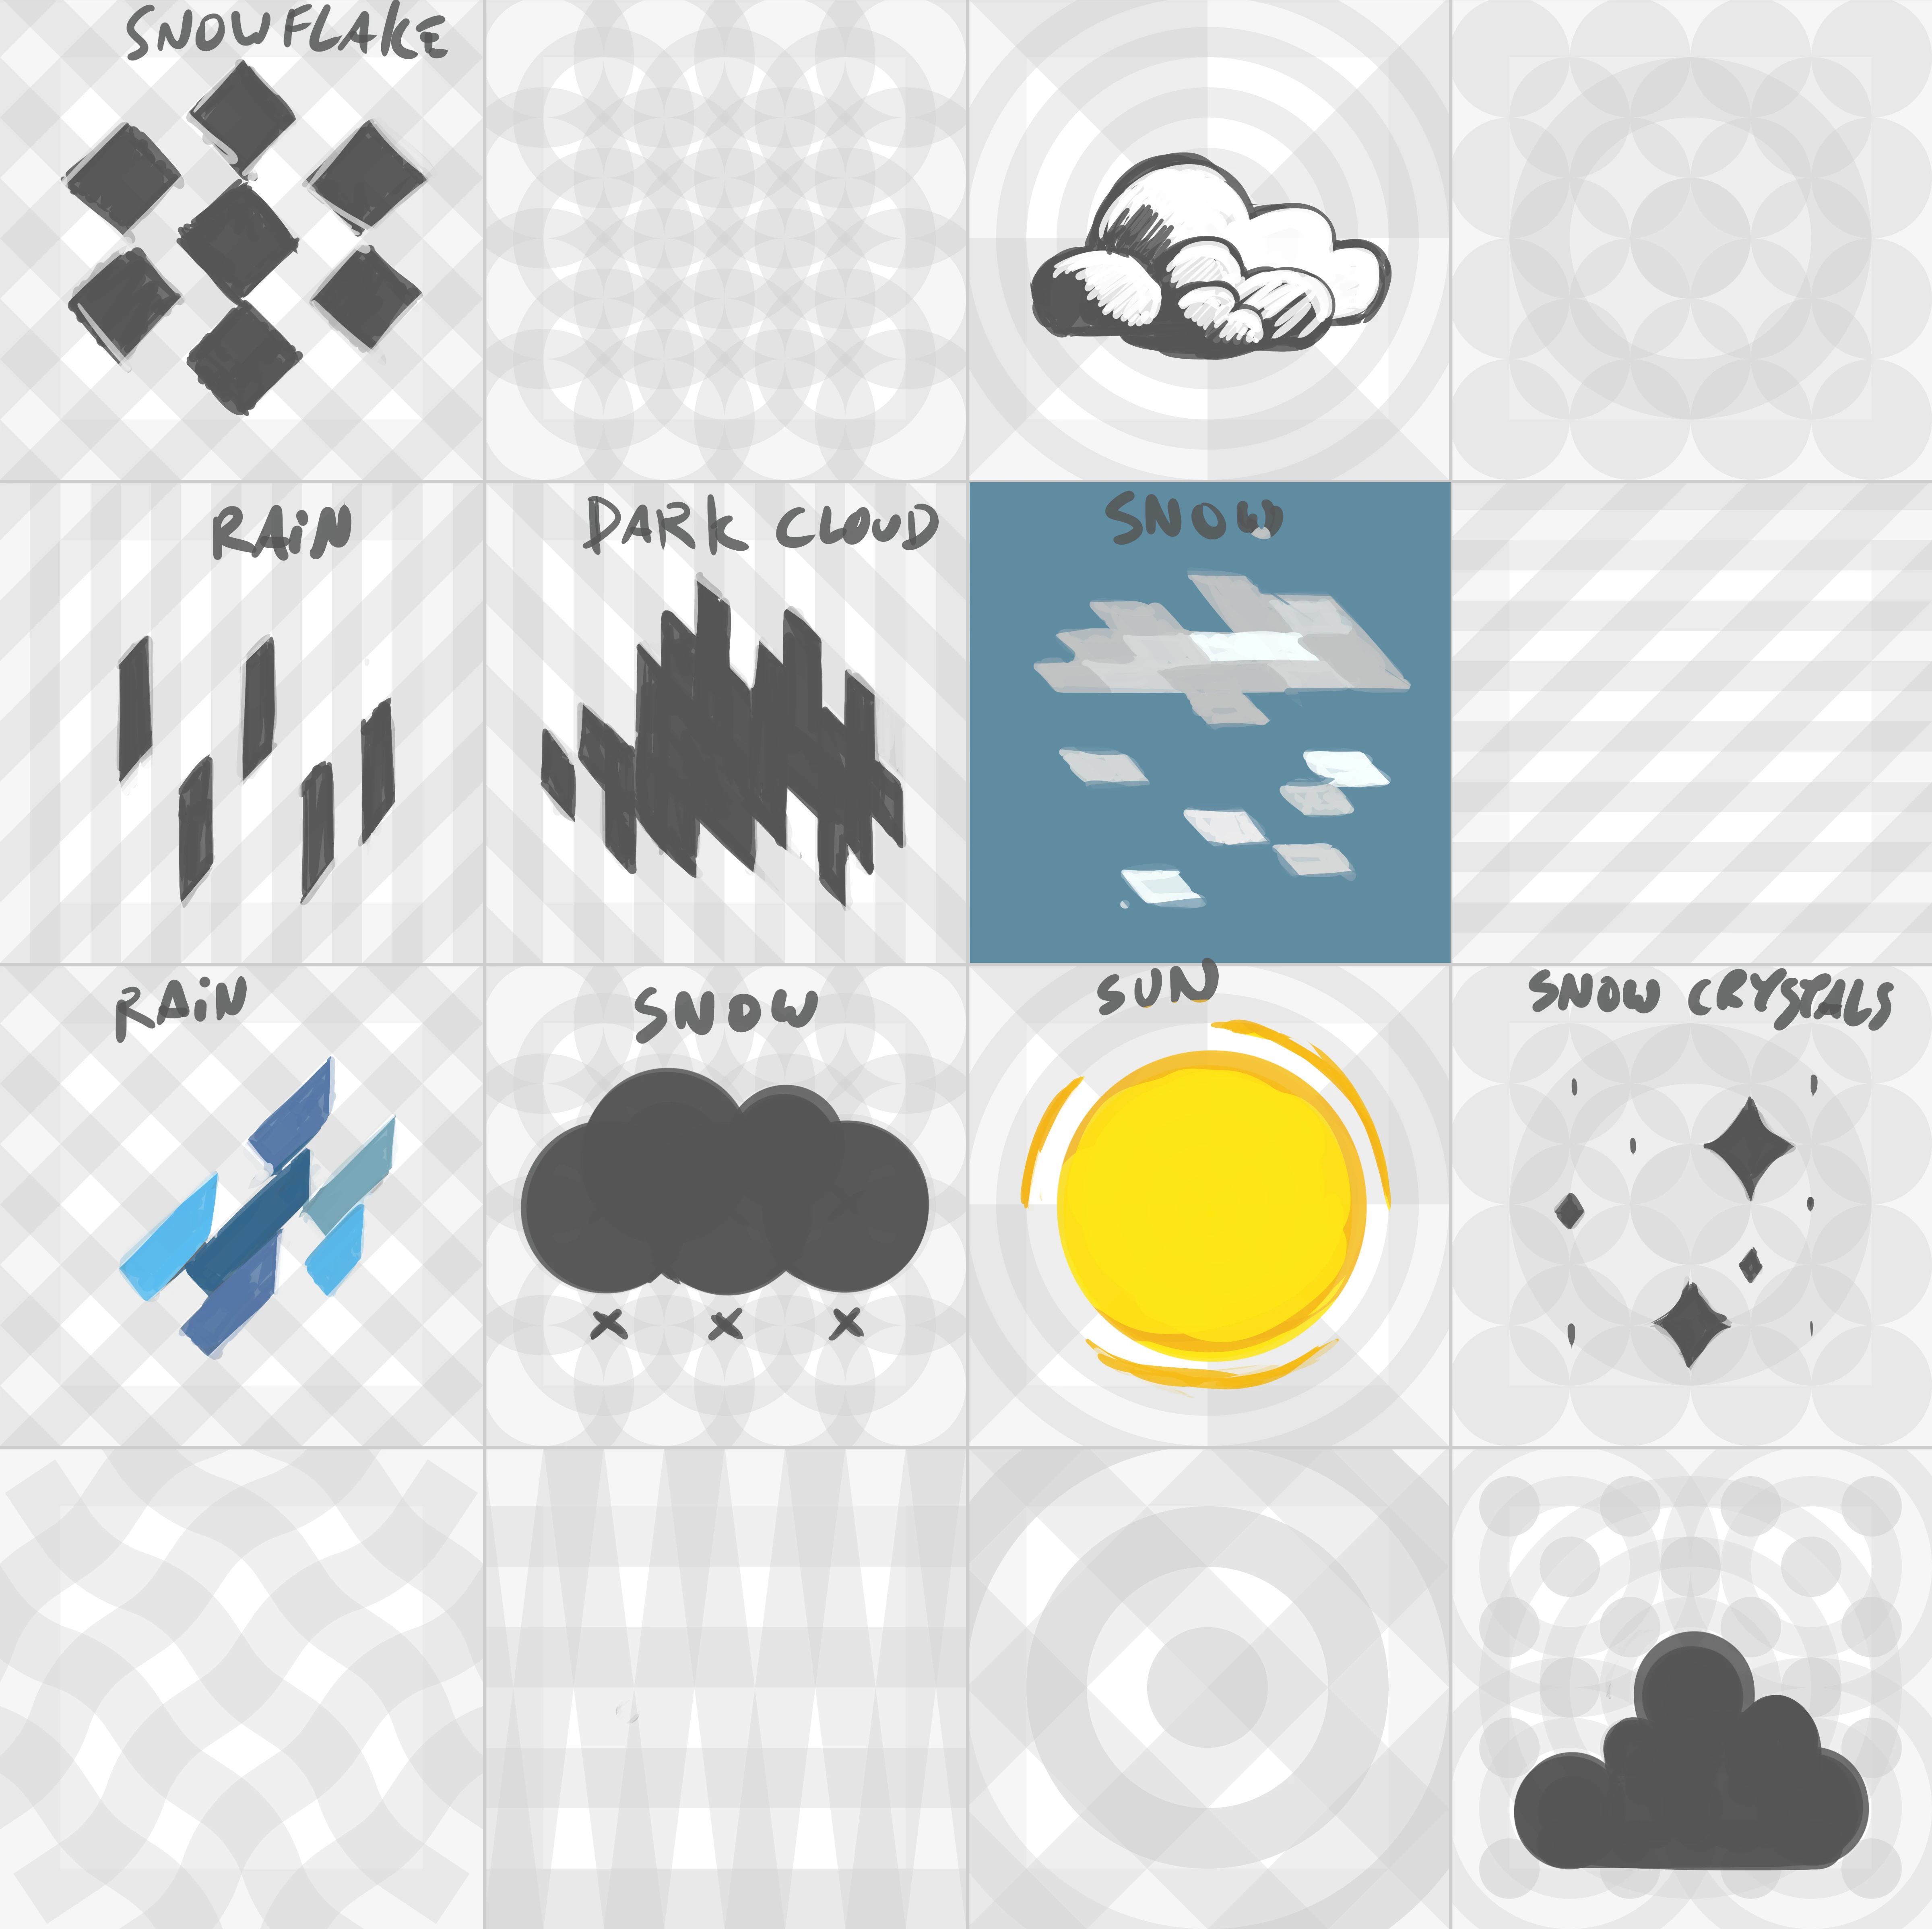
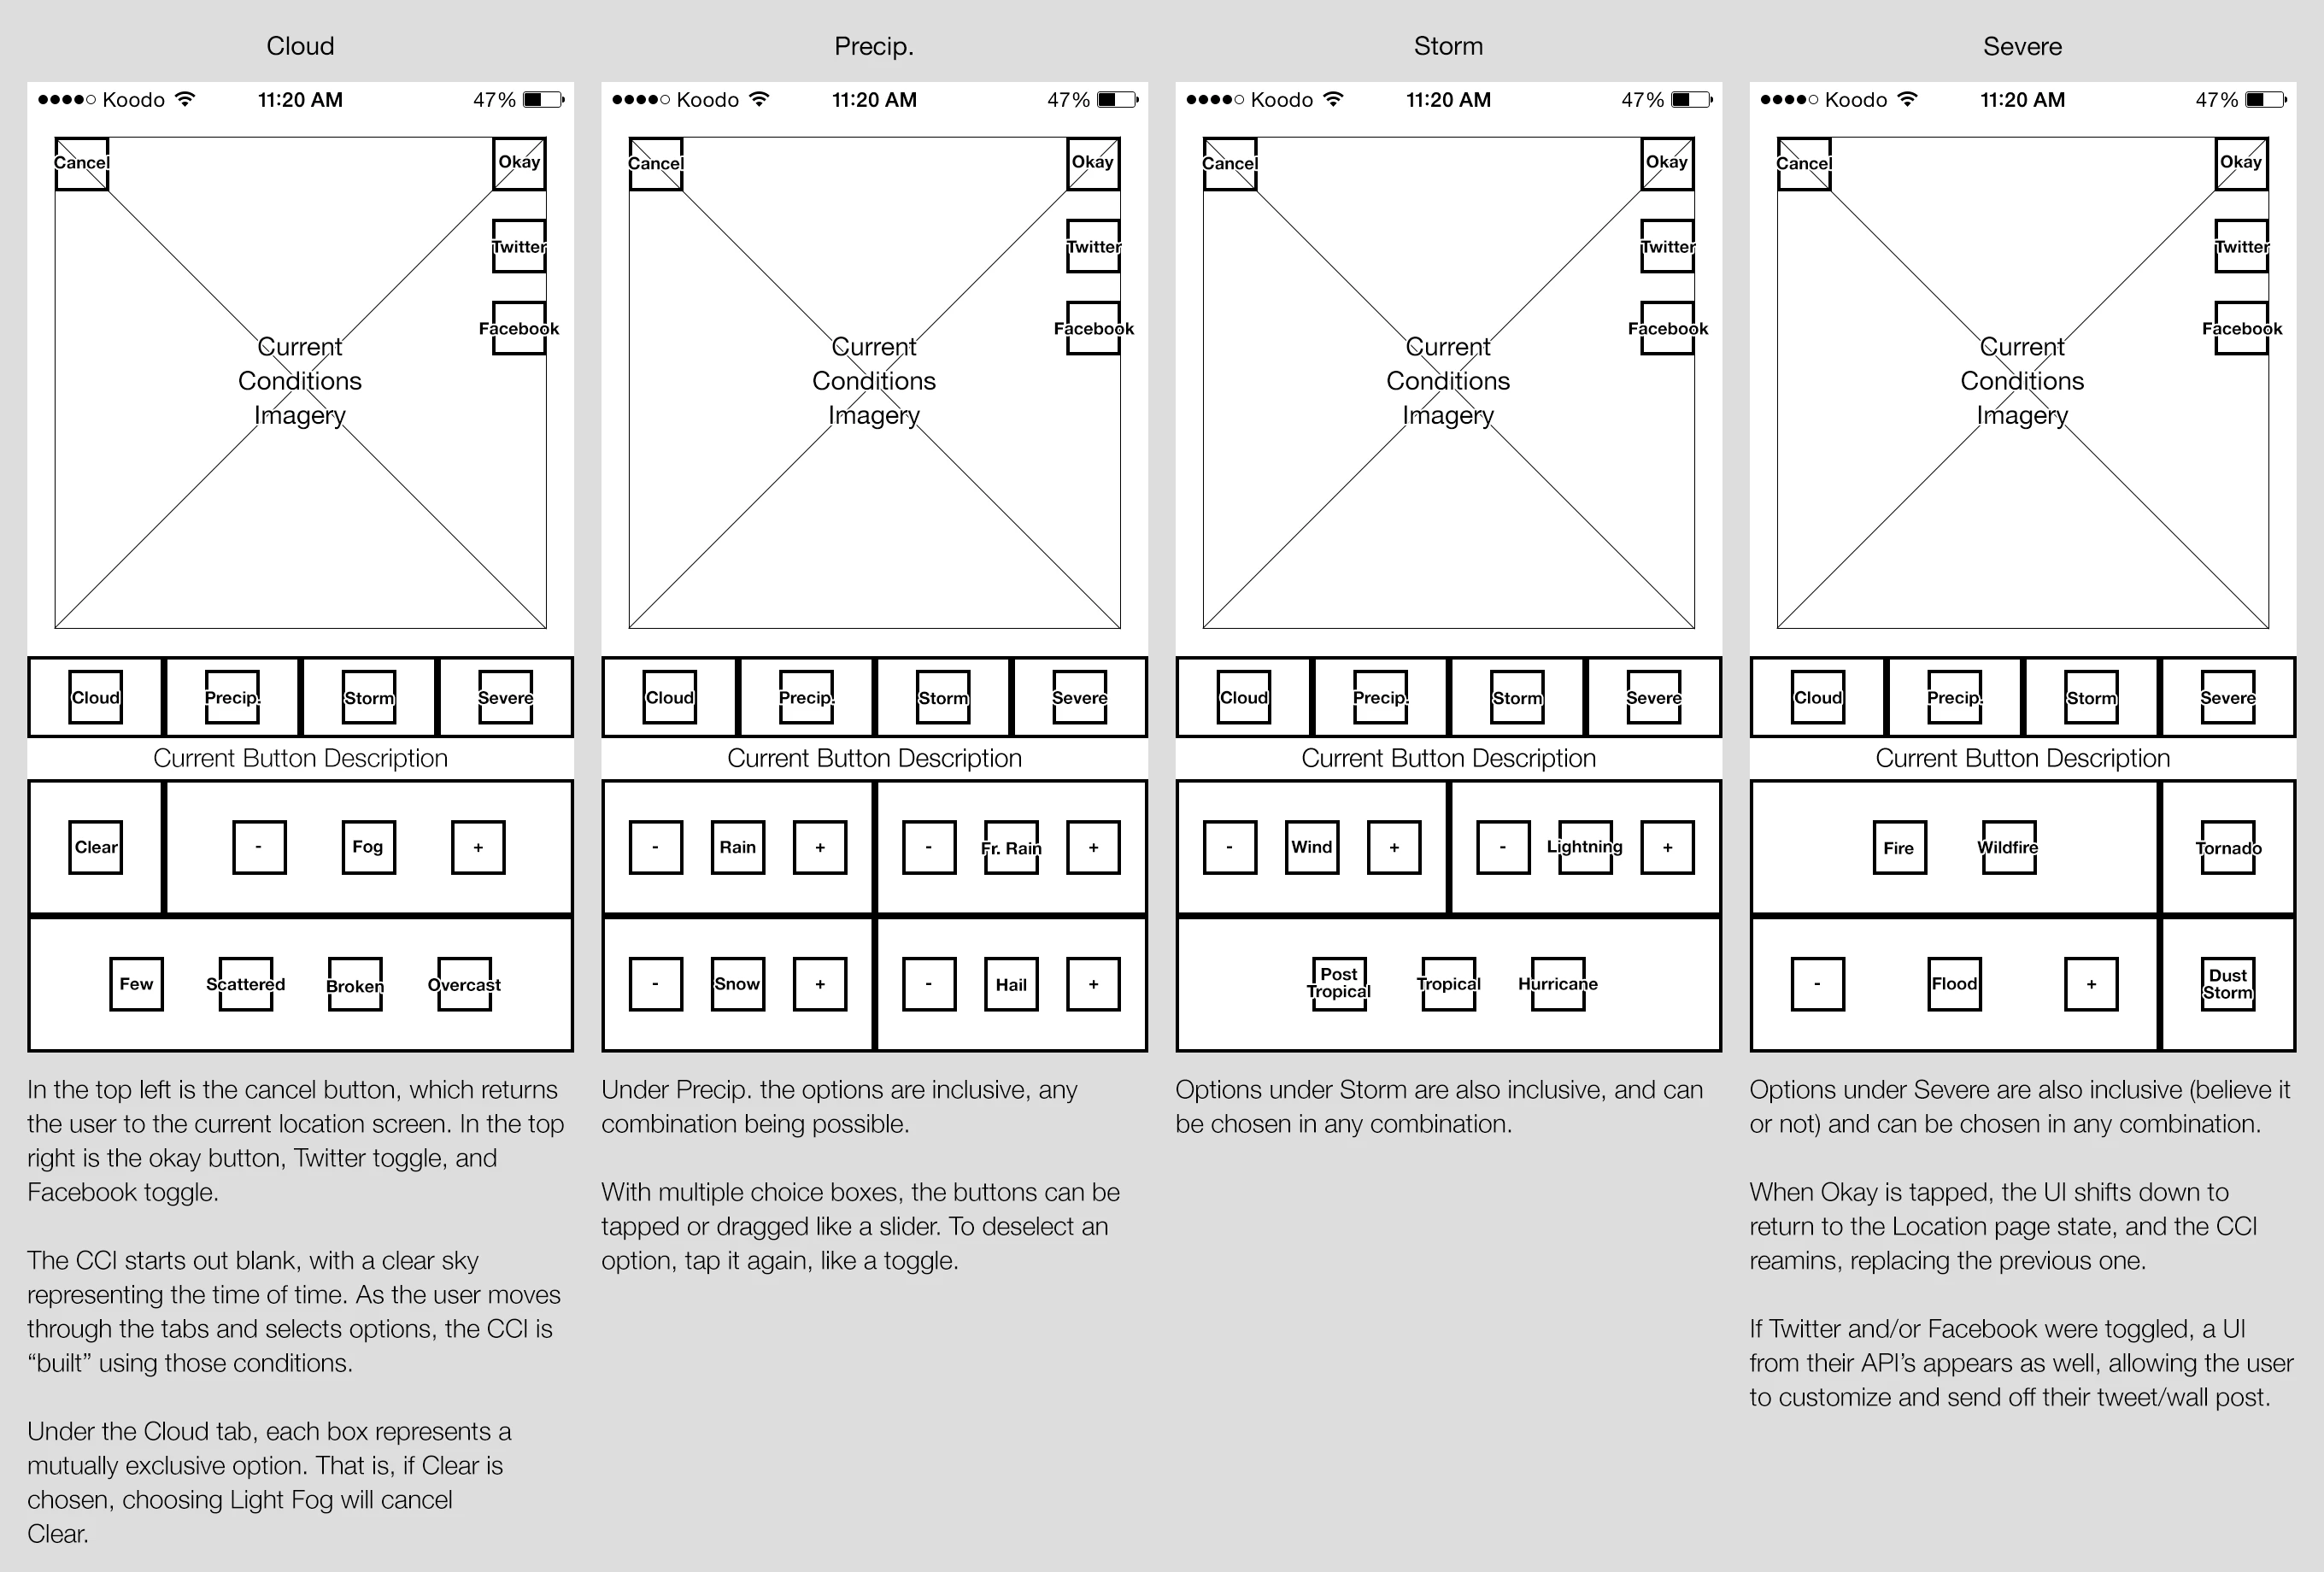
I laid out the Current Conditions UI as a set of rows of icons. As the user chooses the first icon, it determines which set pops up next. This created a fun, quick, universal UI to report the weather in a few seconds. We later added a Tweet button, to let users report to their followers and spread the word about PressureNet.
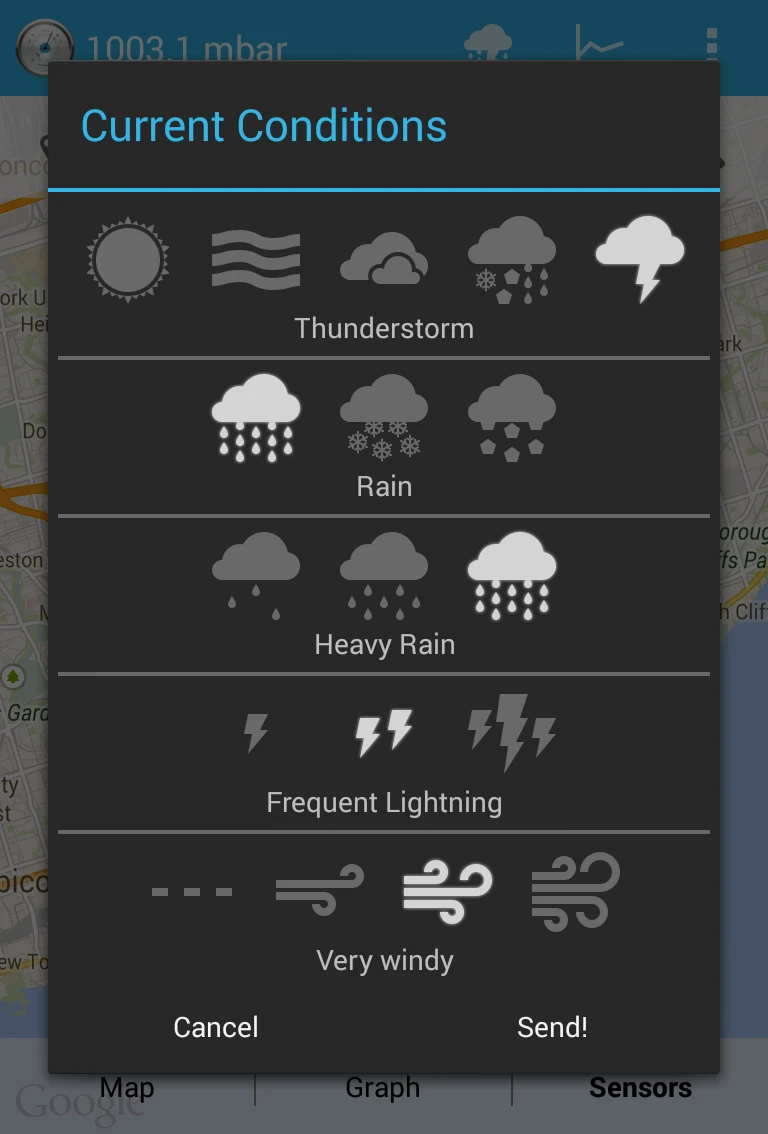
Current Conditions
The Current Conditions UI
To increase the engagement effect of Current Conditions, we sent push notifications to users near the report who would likely be experiencing the same weather, and asked them to confirm the weather they were experiencing. At a large enough scale, this could have defined the edges of weather systems.
Convert the Casual
With a good hook in place to entertain users, all we had to do was grow. We had data coming in, but we needed multiple orders of magnitude more to have a useful amount for analysis and prediction. We had a core audience of users dedicated to the science of it all, but we needed to provide a greater utility to convince further potential users the app was worth installing. Current Conditions dramatically increased the utility, and notifications added a measure of internal virality.
Our last major feature addition to PressureNet was the animated map. The user could select a period of time, and a position on the map, and replay whatever measurements and conditions took place.
Animated Map
This map of Atlanta during the January 2014 winter storm shows clouds moving in on a clear night, give way to immense snowfall, then clear up again.
This feature doubled as an excellent marketing tool. Whenever major weather events occurred Jacob would tweet out a recording of the storm animation.
Experimentation
Another strategy we pursued to grow our contributing user base was the PressureNet API, SDK, and the PressureNet Developer Program. Developers who implemented the SDK and collected data for us would gain access to the full dataset. We developed marketing videos aimed at getting developers to include the SDK in their apps.
Alarm App Video
An example of a possible alarm app that tells you the current conditions once you silence the alarm. The music is cringe-worthy and perfect.
Google Glass Mockup
An AR mockup of what a PressureNet app could look like on Google Glass.
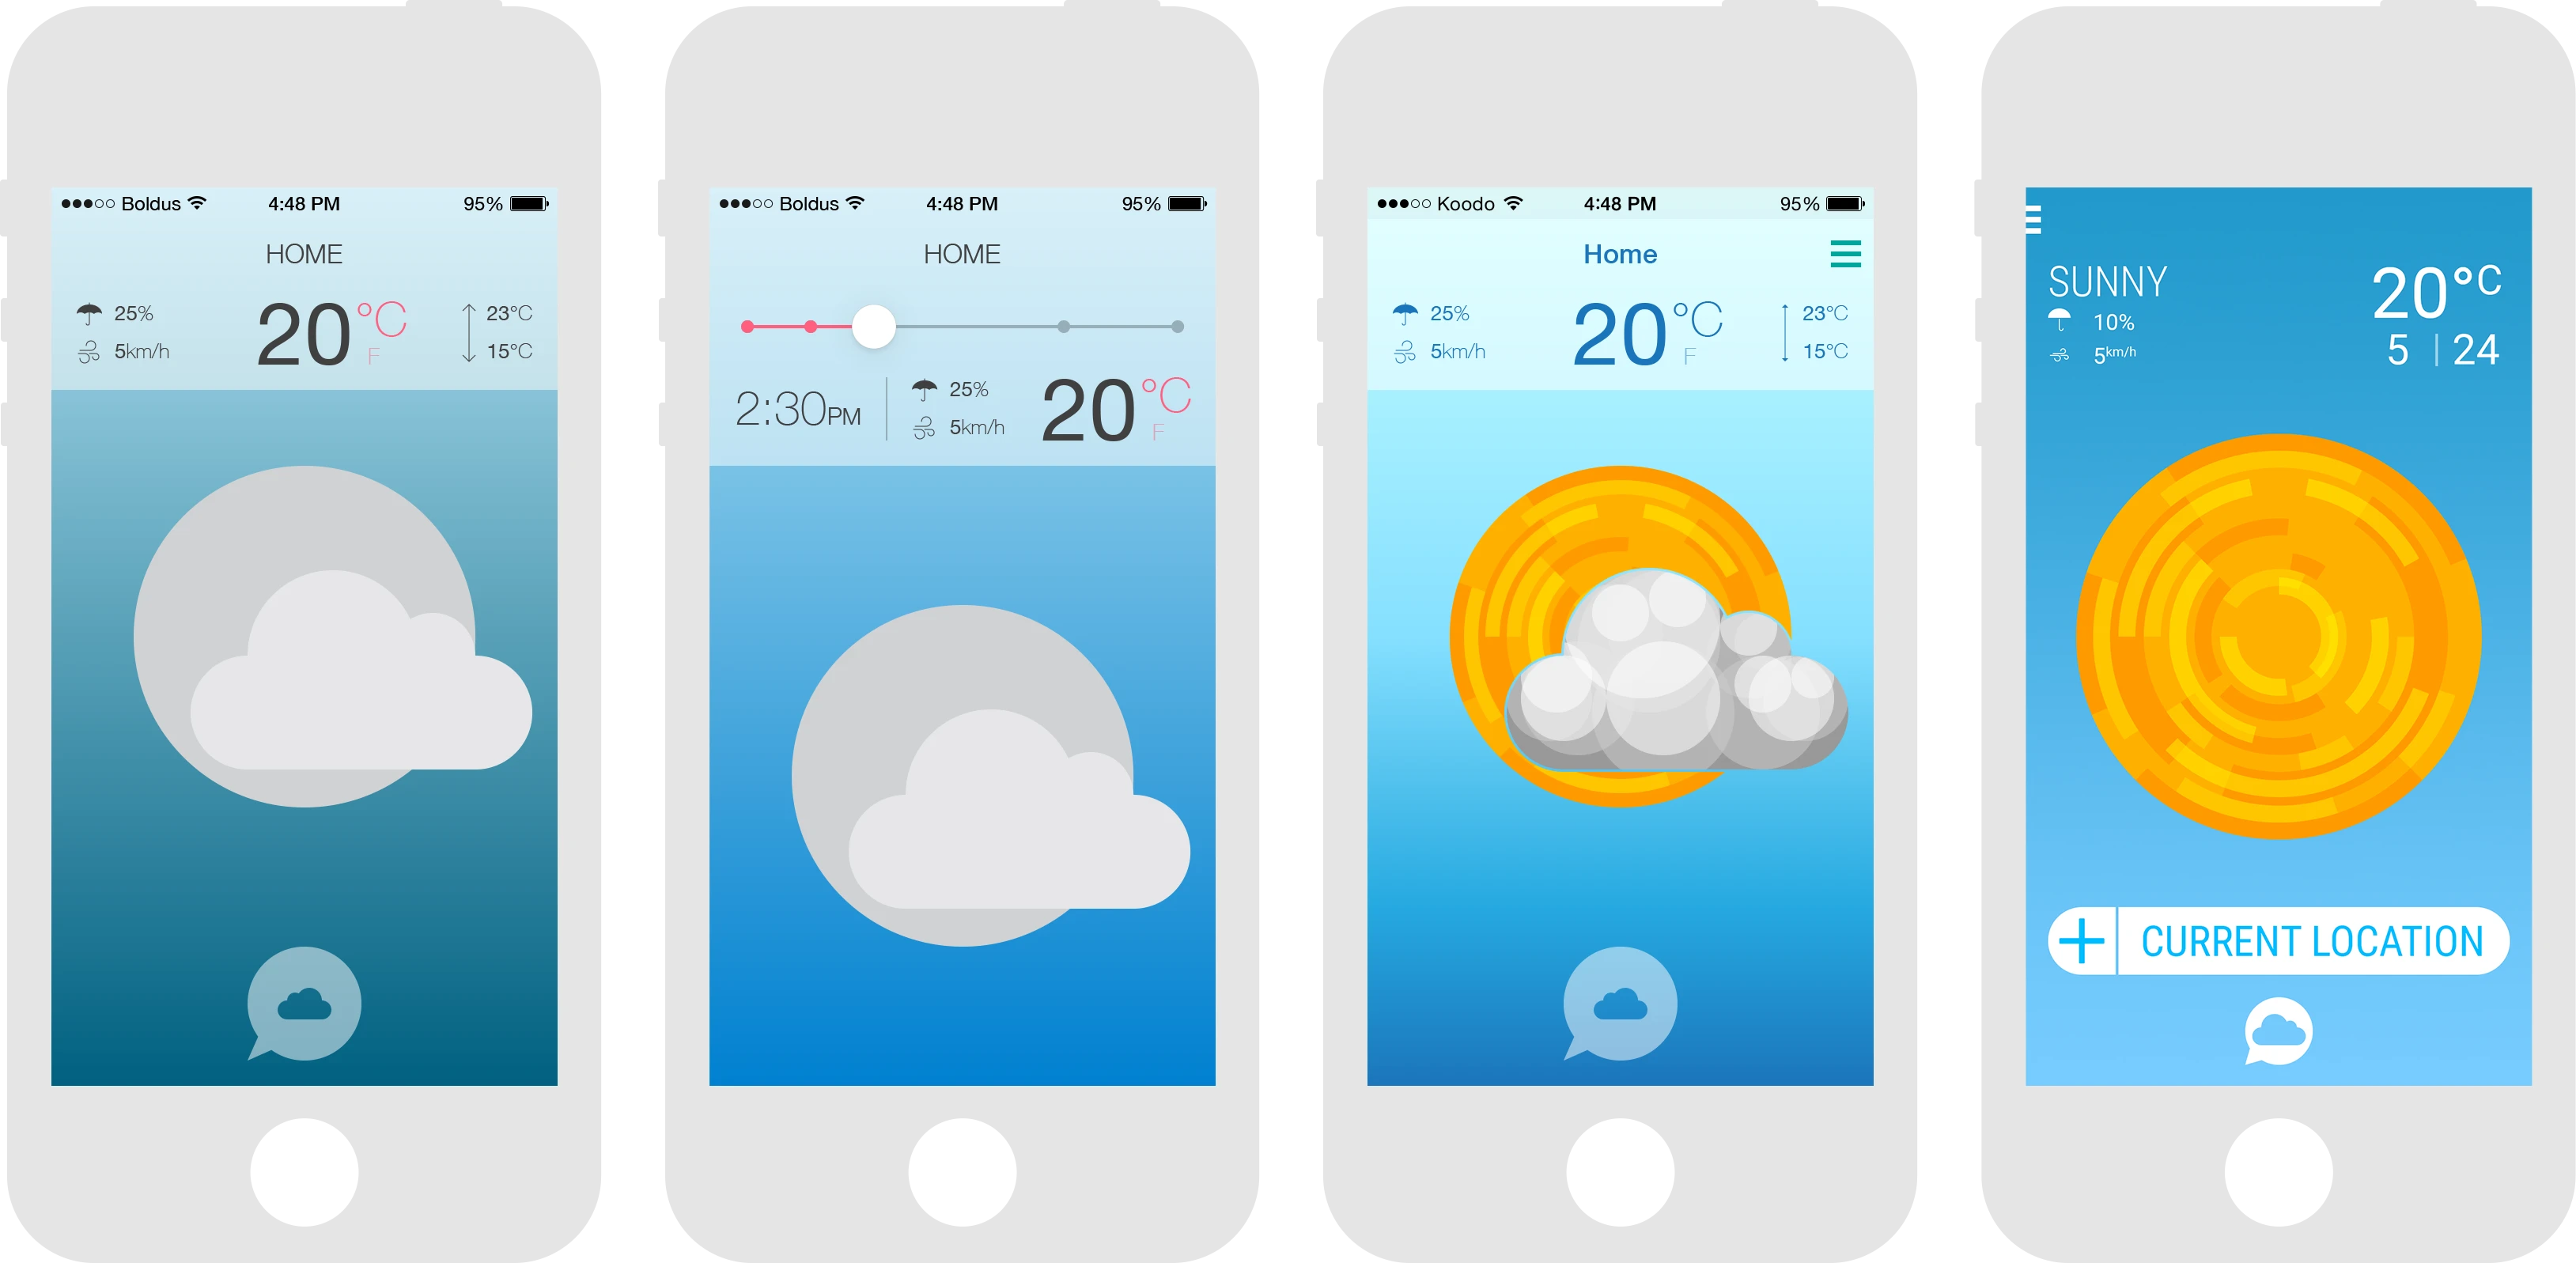
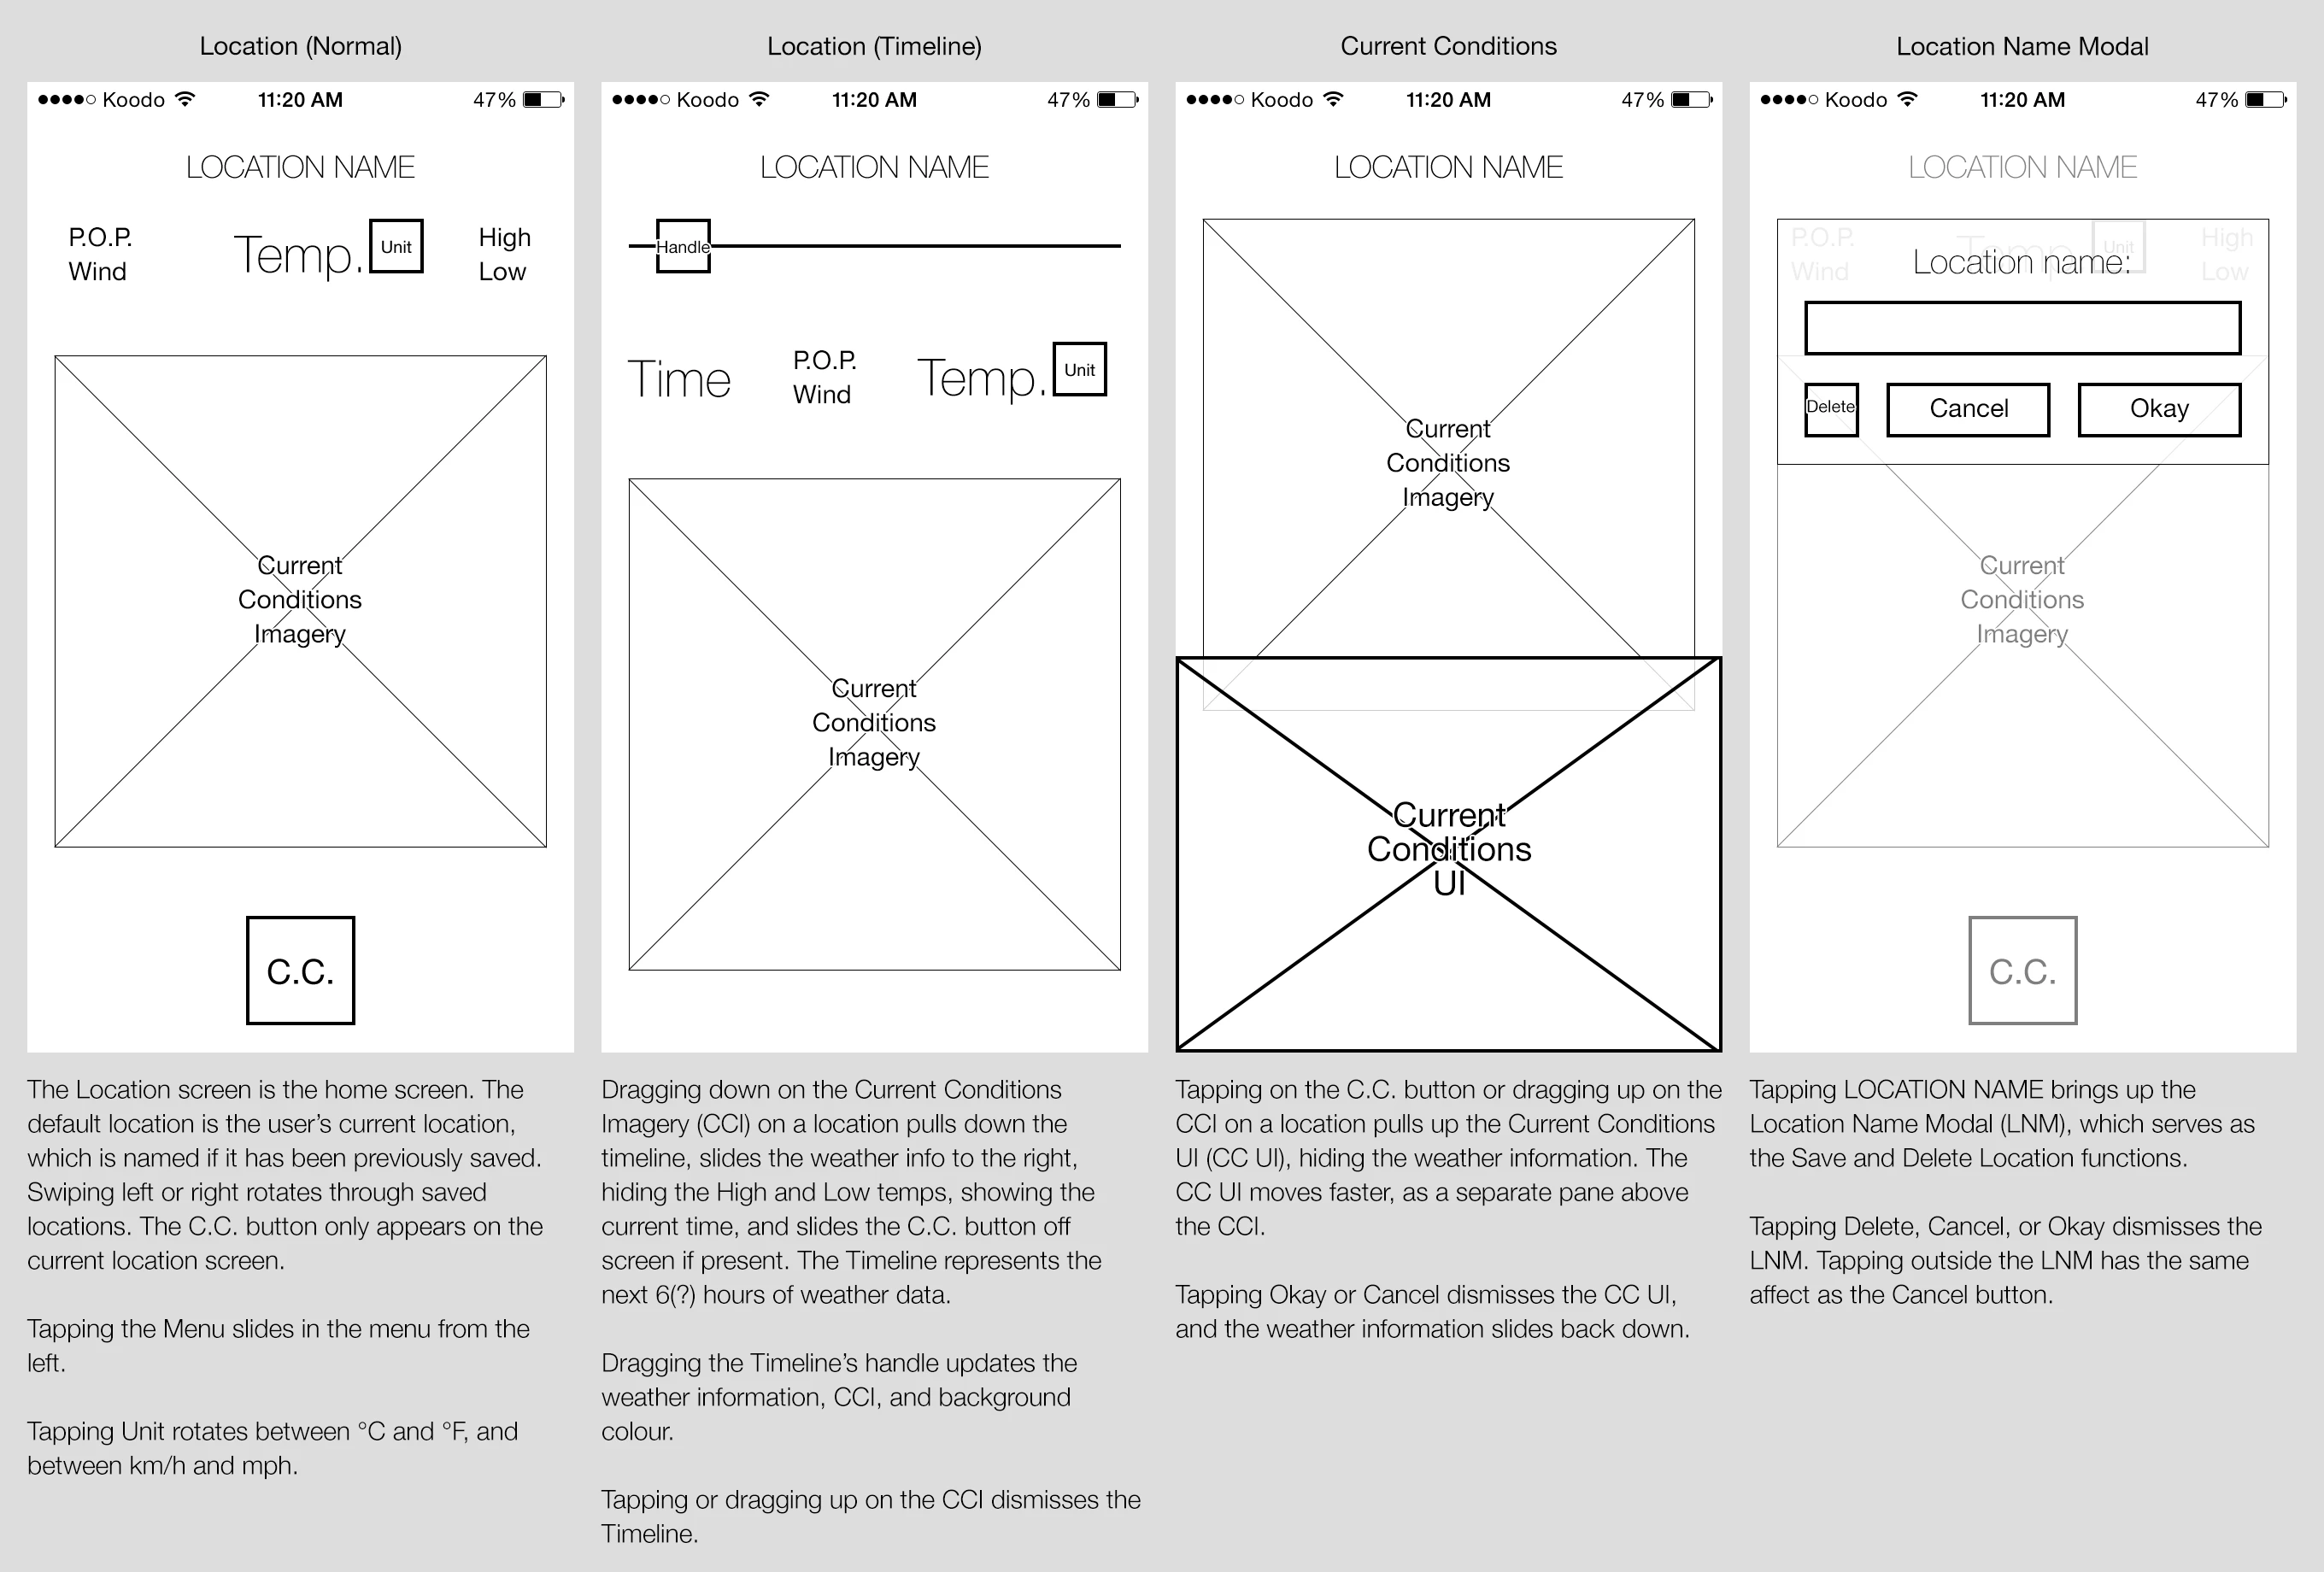
Toward the end of my time at Cumulonimbus Apple decided to include a barometer in their iPhone 6. We knew we had to have an app for iPhone. We didn't just want to launch PressureNet on iOS, we weren't seeing the traction we wanted from that. We reconsidered our whole approach, putting the social weather aspect first, removing the map entirely. The result was Wendy.
At its height, we had funding from the MaRS JOLT incubator in Toronto; we had built the largest weather sensor network ever, with over 500,000 networked sensors; we had scientific backing and interest from experts in the field, most notably Cliff Mass at the University of Washington, as well as researchers at University of Toronto, MIT, and Waterloo; we had media writeups and interviews in Scientific American, BBC World Service, MIT Technology Review, and WIRED. We even had interest from both the Weather Network in Canada and the Weather Channel in the US.
It was a great idea, but it just wasn't quite a business.